
flask核心就两部分:路由解析和模板渲染
app.py中
from flask import Flask,render_template,request
import datetime

app = Flask(__name__)


# @app.route('/')
# def hello_world():
#     return 'hello world!'

#debug模式开启

@app.route('/index')
def hello():
    return '你好'

@app.route('/user/<name>')  #通过访问路径,获取用户字符串参数
def welcom(name):
    return '你好,%s'%name

@app.route('/user/<int:id>')    #通过访问路径,获取用户整型参数,此外,还有float
def welcom2(id):
    return '你好,%d号'%id

# @app.route('/')
# def index():
#     return render_template("index.html")    #返回渲染后的模板

#向页面传一个变量
@app.route('/')
def index():
    time = datetime.date.today()    #普通变量
    name = ["小张","小王","小李"]     #列表类型
    task = {"任务":"打扫卫生","时间":"三小时"} #字典类型
    return render_template("index.html",var=time,list=name,task=task)    #返回渲染后的模板

#表单提交
@app.route('/test/register')
def register():
    return render_template("test/register.html")

#接收端需要有methods为post
@app.route('/result',methods=['POST','GET'])
def result():
    if request.method=="POST":
        result = request.form   #返回字典类型
        return render_template("test/result.html",result=result)


if __name__ == '__main__':
    app.run()
templates/index.html
<!DOCTYPE html>
<html lang="en">
<head>
    <meta charset="UTF-8">
    <title>Title</title>
</head>
<body>
    今天是{{ var }}欢迎您!!!<br/>
    今天值班的有:<br>
    {% for data in list %}      <!--表示控制结构 -->
        <li>{{ data }}</li>
    {% endfor %}

    任务:<br>
        <table border="1">
            {% for key,value in task.items() %}
            <tr>
                <td>{{key}}</td>
                <td>{{value}}</td>
            </tr>
            {% endfor %}
        </table>

</body>
</html>
templates/test/register.html
<!DOCTYPE html>
<html lang="en">
<head>
    <meta charset="UTF-8">
    <title>Title</title>
</head>
<body>
<form action="{{ url_for('result') }}" method="post">
    <p>姓名:<input type="text" name="姓名"></p>
    <p>年龄:<input type="text" name="年龄"></p>
    <p>性别:<input type="text" name="性别"></p>
    <p>地址:<input type="text" name="地址"></p>
    <p><input type="submit" value="提价"></p>
</form>
</body>
</html>
templates/test/result.html
<!DOCTYPE html>
<html lang="en">
<head>
    <meta charset="UTF-8">
    <title>Title</title>
</head>
<body>
<h1>result</h1>
<table border="1">
            {% for key,value in result.items() %}
            <tr>
                <th>{{key}}</th>
                <td>{{value}}</td>
            </tr>
            {% endfor %}
        </table>
</body>
</html>
在movie.db有数据前提下实现数据可视化的几种方法
展示一下最终达到的效果

步骤:
- 先找到前端页面的模板代码,结合flask实现简单的页面呈现和跳转
- 对数据库表中movie250查询出来,在网页上以表格的方式呈现出来
- echarts可以很方便实现各种图的展示
- 词云展示
1
@app.route('/movie')
def movie():
datalist=[]
con = sqlite3.connect("movie.db")
cur = con.cursor()
sql = "select * from movie250"
data = cur.execute(sql)
for item in data:
datalist.append(item)
cur.close()
con.close()
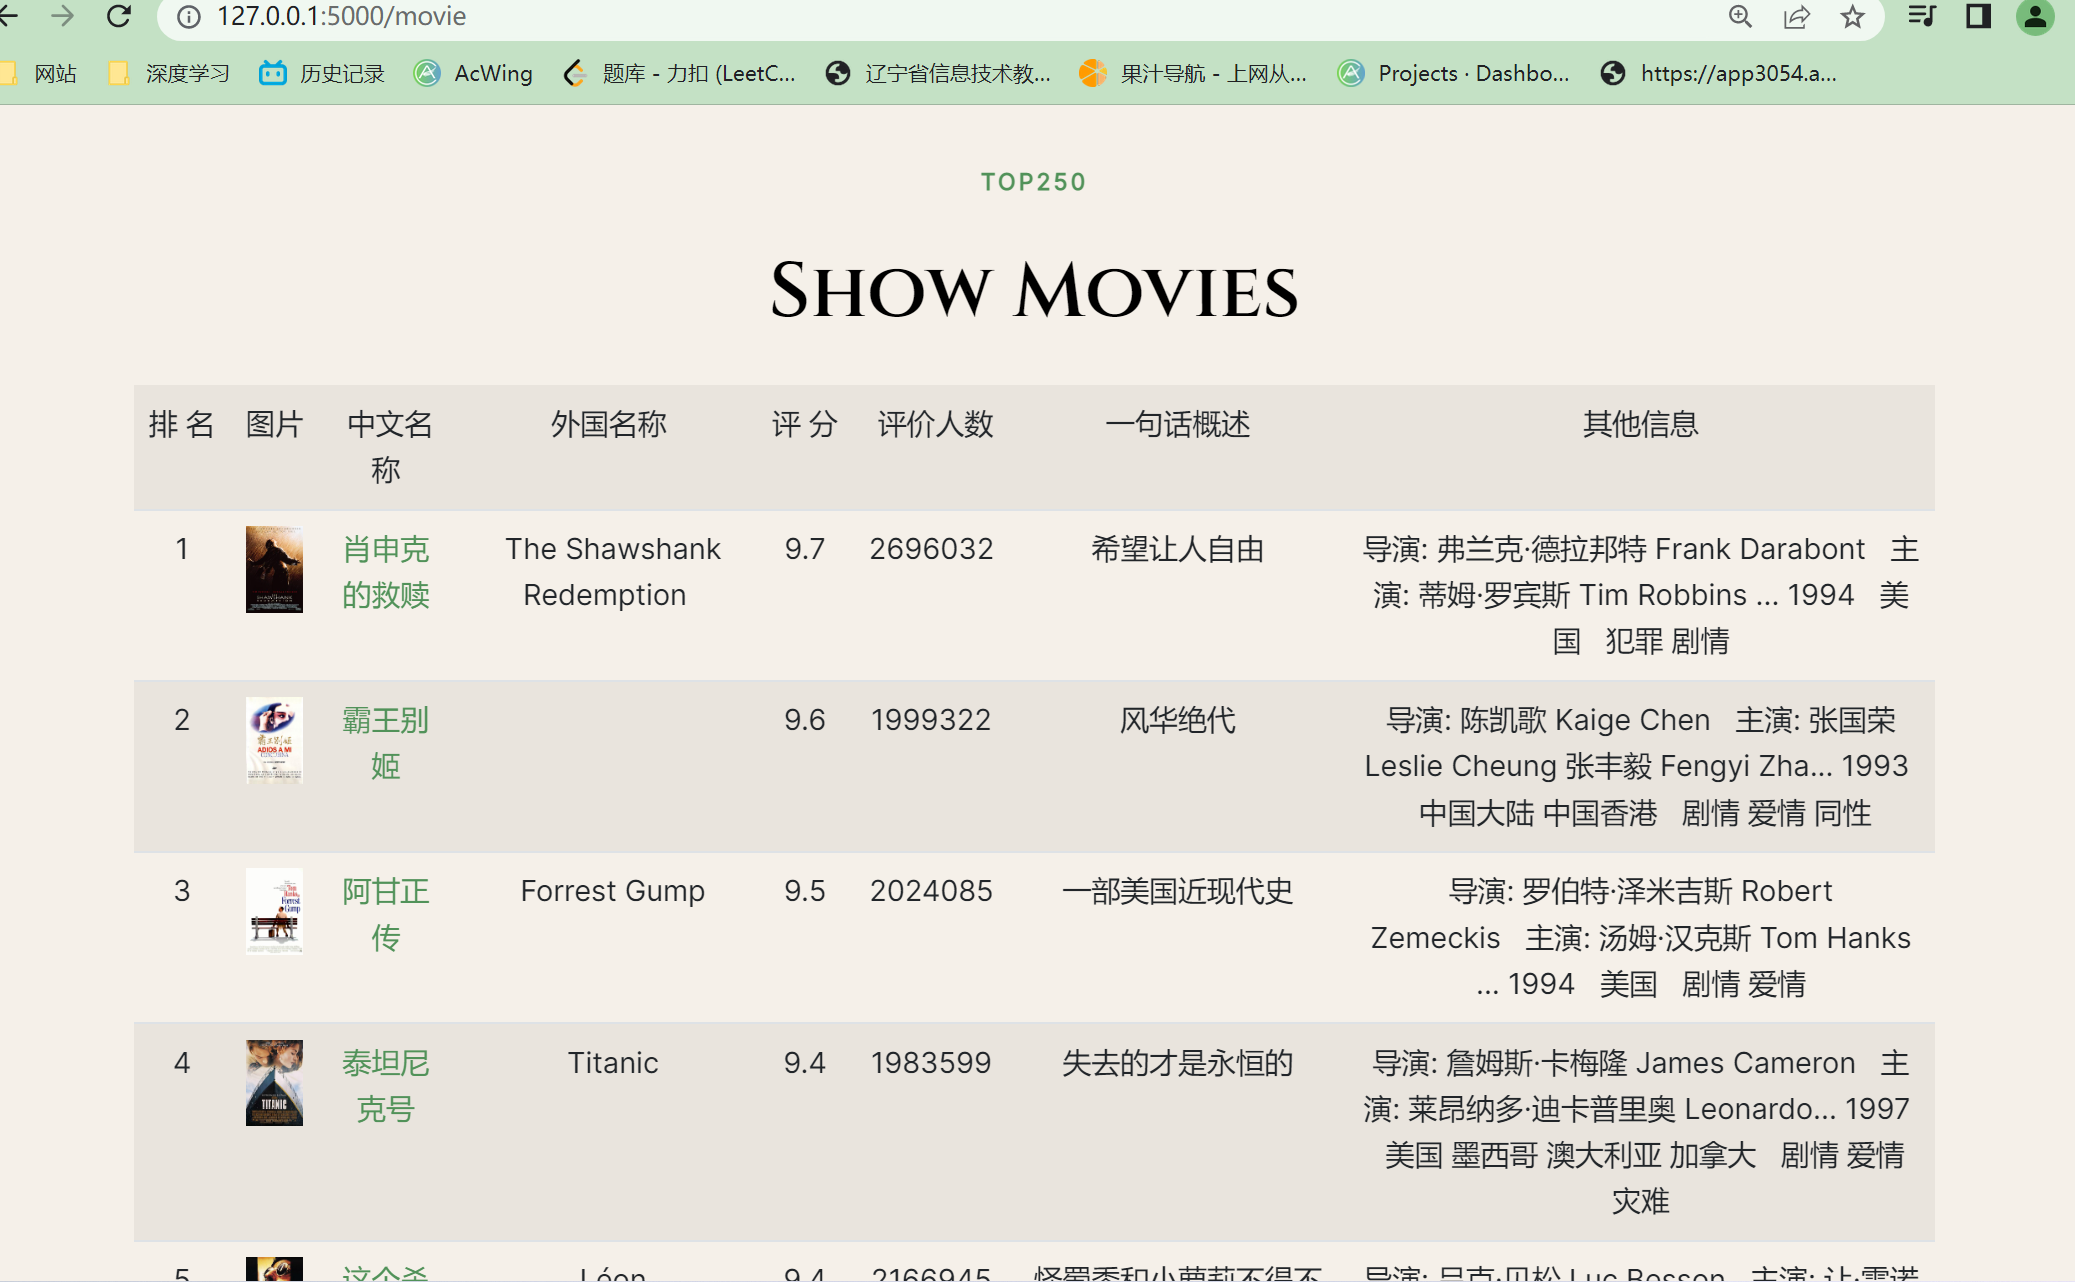
return render_template("movie.html",movies=datalist)
<table class="table table-striped">
<tr>
<td>排 名</td>
<td>图片</td>
<td> 中文名称</td>
<td> 外国名称</td>
<td>评 分</td>
<td> 评价人数</td>
<td>一句话概述</td>
<td>其他信息</td>
</tr>
{% for movie in movies %}
<tr>
<td>{{movie[0]}}</td>
<td><img src="{{ movie[2] }}" width="30px" height="45px"></td>
<td>
<a href="{{ movie[1] }}" target="_blank">{{movie[3]}}</a>
</td>
<td>{{movie[4]}}</td>
<td>{{movie[5]}}</td>
<td>{{movie[6]}}</td>
<td>{{movie[7]}}</td>
<td>{{movie[8]}}</td>
</tr>
{% endfor %}
</table>
在/movie页面上,先连接数据库,打开数据库,取得游标进行查询操作,将查到的数据一行一行地添加到datalist中。关闭游标,关闭数据库连接。返回数据给前端页面。
前端页面取到传来的数据,以表格的形式呈现,注意其中for循环的写法和每一列数据的取法,显示一行行的全部数据在网页上。
2
@app.route('/score')
def score():
score=[] #评分
num=[] #同一评分的个数个数
con = sqlite3.connect("movie.db")
cur = con.cursor()
sql = "select score,count(score) from movie250 group by score"
data = cur.execute(sql)
for item in data:
score.append(item[0]) #如果是转str(),前端页面那{{ score| tojson}}
num.append(item[1])
cur.close()
con.close()
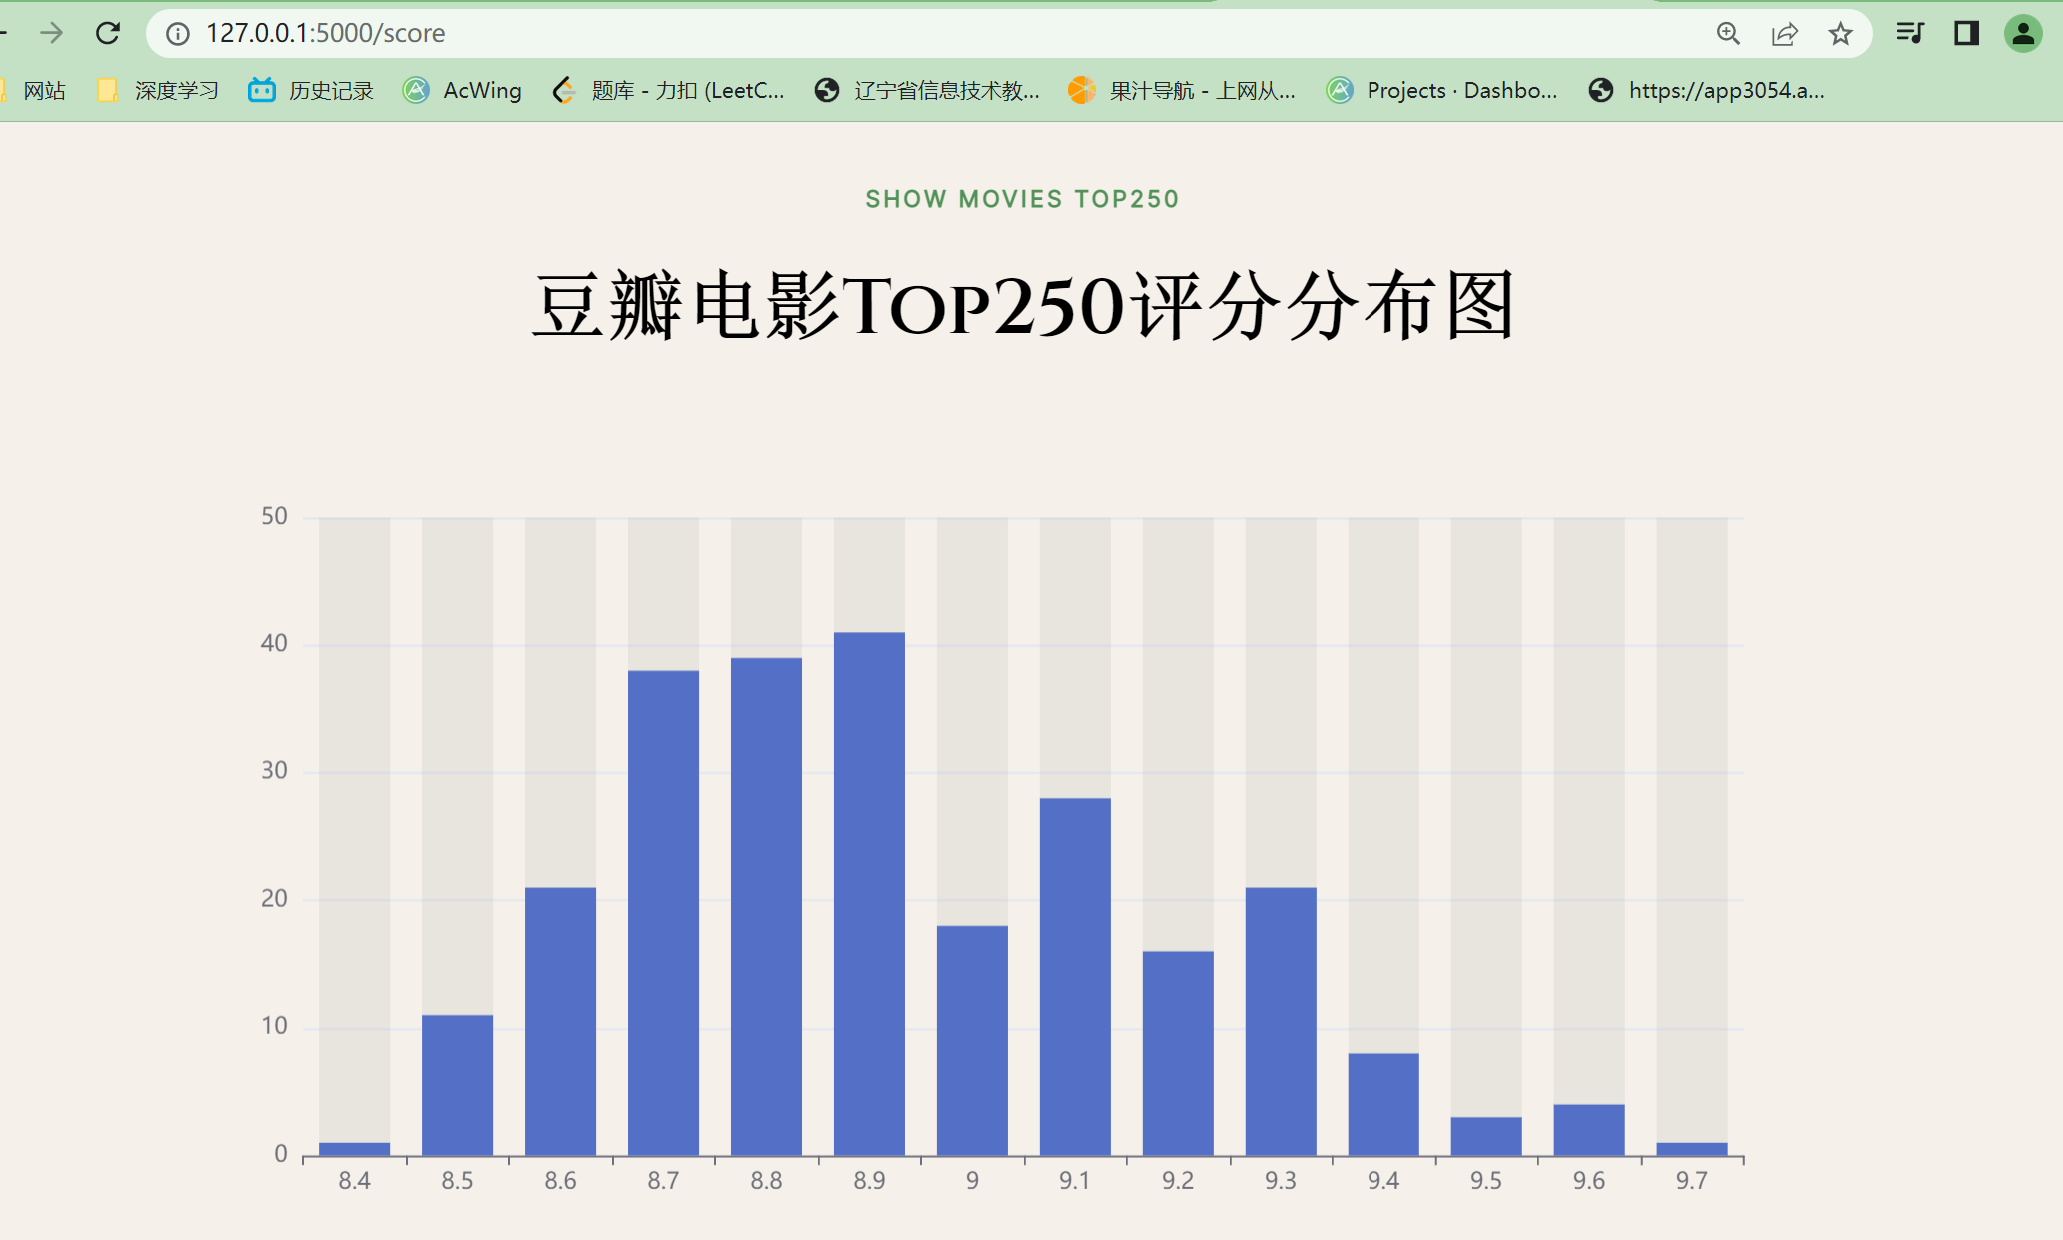
return render_template("score.html",score=score,num=num)
1.在前端页面head中
<!--引入echarts文件 -->
<script src="static/js/echarts.min.js"></script>
<script type="text/javascript" src="https://fastly.jsdelivr.net/npm/echarts@5.3.3/dist/echarts.min.js"></script>

2.在需要放柱状图等各种可视化图的地方放此模块
<div id="main" style="width: 100%;height:400%;"></div>

3.在文末放script代码段
<script type="text/javascript">
    var dom = document.getElementById('main');
    var myChart = echarts.init(dom, null, {
      renderer: 'canvas',
      useDirtyRect: false
    });
    var app = {};

    var option;

    option = {

  tooltip: {
    trigger: 'axis',
    axisPointer: {
      type: 'shadow'
    },
    grid: {
    left: '3%',
    right: '4%',
    bottom: '3%',
    containLabel: true
    },
  },
  xAxis: {
    type: 'category',
    data: {{ score }}
        <!--['Mon', 'Tue', 'Wed', 'Thu', 'Fri', 'Sat', 'Sun']-->
  },
  yAxis: {
    type: 'value'
  },
  series: [
    {
      data: {{ num }},
          <!--[120, 200, 150, 80, 70, 110, 130],-->
      type: 'bar',
      showBackground: true,
      backgroundStyle: {
        color: 'rgba(180, 180, 180, 0.2)'
      },
      emphasis: {
        itemStyle: {
          borderColor: 'transparent',
          color: 'orange'
        }
      },
    }

  ]
};

    if (option && typeof option === 'object') {
      myChart.setOption(option);
    }

    window.addEventListener('resize', myChart.resize);
  </script>
Apache ECharts一个基于 JavaScript 的开源可视化图表库
https://echarts.apache.org/zh/index.html
先在网站上调整好,直接下载应用即可
3
import jieba    #分词
from matplotlib import pyplot as plt    #绘图,数据可视化
from wordcloud import WordCloud         #词云
from PIL import Image                   #图片处理
import numpy as np                      #矩阵运算
import sqlite3

#准备词云所需的文字(词)
con = sqlite3.connect("movie.db")
cur = con.cursor()
sql = 'select introduction from movie250'
data = cur.execute(sql)
text = ""
for item in data:
    text = text+item[0]
# print(text)
cur.close()
con.close()

#分词
cut = jieba.cut(text)
string = ' '.join(cut)
# print(string)
# print(len(string))

img = Image.open(r'.\static\image\ahhh.jpg')    #打开遮罩图片
img_array = np.array(img)  #将图片变成图片数组
wc = WordCloud(
    background_color='white',
    mask=img_array,
    # font_path="HGKT1_CNKI.TTF"    #楷书字体所在位置C:\Windows\Fonts
    font_path="msyh.ttc"    #微软雅黑字体所在位置C:\Windows\Fonts
)
wc.generate_from_text(string)

#绘制图片
fig = plt.figure(1)
plt.imshow(wc)
plt.axis('off')

# plt.show()    #显示图片

# 输出词云图片到文件
plt.savefig(r'.\static\image\wc.jpg',dpi=500)
最后完成词云绘制,将得到的图片放到网站上
满意的记录
hxd 求一下数据集可以吗